🚀 Container Exporter (CXP)
A resource-friendly, highly efficient Prometheus exporter for monitoring Docker containers' Memory, CPU, Disk, and Network I/O usage — with uptime tracking.
when a container is not running due to whatever reason cxp removes all its stats metrics (cpu,
memory, etc.)
(if CONTAINER_EXPORTER_CLEAR_METRICS=True otherwise they are set to 0 to retain time series data.)
but keeps its status ( running/not-running/(restarting/unhealthy) ) to facilitate alerting in case something
goes wrong with that contaier.
Check out a sample of the metrics output here to see how it works.
📚 Table of Contents
🛠️ DEV STACK
🎥 DEMO
Config and Settings
Uvicorn
the following settings can be set via exporting environment variables and are applied to
start.sh entrypoint.
HOST (Default: 0.0.0.0)PORT (Default: 8000)WORKERS:(Default : 1)- LOG_LEVEL (Default : warning)
Prometheus Multi-Processesing needed, not Implemented yet as of version [1.3.0]
App Settings
the following settings can be set via exporting environment variables or a .env file.
CONTAINER_EXPORTER_CLEAR_METRICS(Default: True)
when set to False the metrics for container stats will not be fully cleared and set to zero to retain
the time series data recorded for that container.
note that only Gauge Metrics can be set to zero, so network and
disk io settings will be fully cleared either way.
📋 Deployment Guide
Before You Start
- Ensure port
8000is open - Docker & Docker Compose installed (optional)
- Git and Python ≥ 3.10 available
⚙️ Deploy with GitHub Actions
- Fork the repository.
- Go to the forked repository and switch to the Actions tab.
- Click the
I understand my workflows, go ahead and enable thembutton. - Now you have access to all of the workflows; however, make sure you change the secrets listed below
accordingly:
secrets.DOCKER_TOKEN: the personal access token for Docker Hub of your (or your organization’s) account.secrets.GHCR_TOKEN: GitHub classic access token withpackages:read-writepermissions, or simply use${{ github.token }}.
How Workflows Work
- On push to
master, the project will be built, deployed, and released. Since deploying to your servers requires runner configuration, it must be triggered manually; you can modify its behavior in thecd.ymlworkflow. - On push to any branch except
master, code will be built and health-checked. - On pull request, the project will be health-checked and built.
With Docker Compose
git clone https://github.com/Shayan-Ghani/Container-exporter.git
cd Container-Exporter
chmod +x ./start.sh
docker-compose -f container-exporter.yml up -d
Without Docker
python3 -m venv venv
source venv/bin/activate
pip install -U pip
pip install -r requirements.txt
./start.sh &
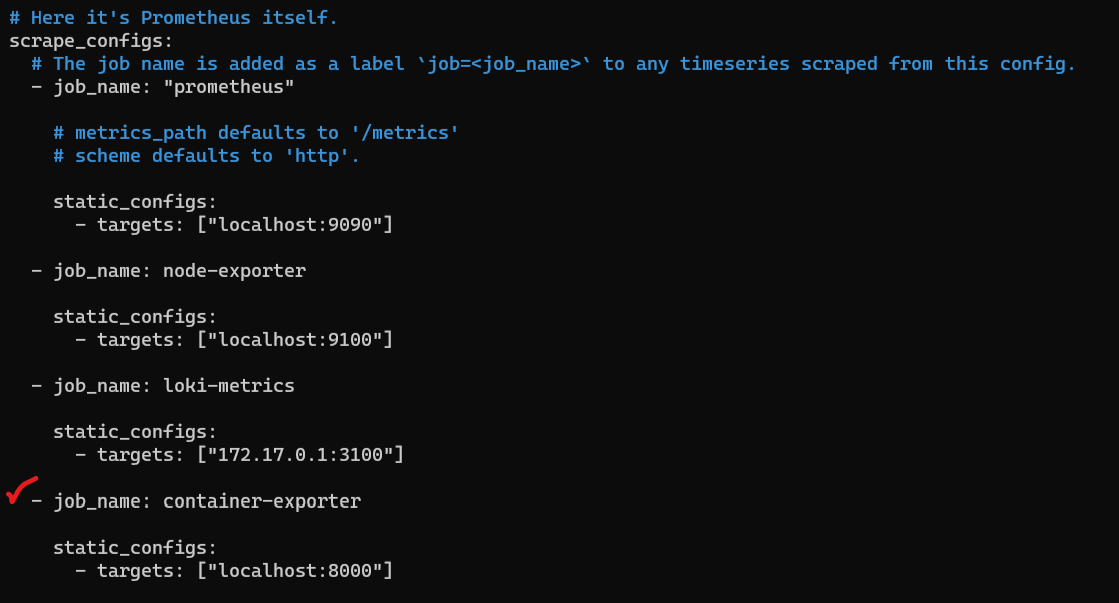
Add CXP to Prometheus
Modify your prometheus.yml scrape configs and point to localhost:8000/metrics.
📊 Grafana Dashboards
Import dashboards from the ./dashboards directory and use dashboard-gen.sh
to auto-replace datasource UIDs.
Alerting Rules
A page of sample Prometheus rules can be accessed here . setting alerts
on cxp_container_status is one of the main points users prefer CXP
overcAdvisor.